This is an example of portfolio detail
Project information
- Category: Data Visualization
- Client: Freelance Project
- Project URL: View My Tableau Public
This project reolves around visualizing the distribution of Netflix viewership for both movies and TV shows worldwide. It aims to provide insights into which movies and TV shows are the most popular among Netflix users and offers a comparative analysis of viewership between these two content categories on the platform.
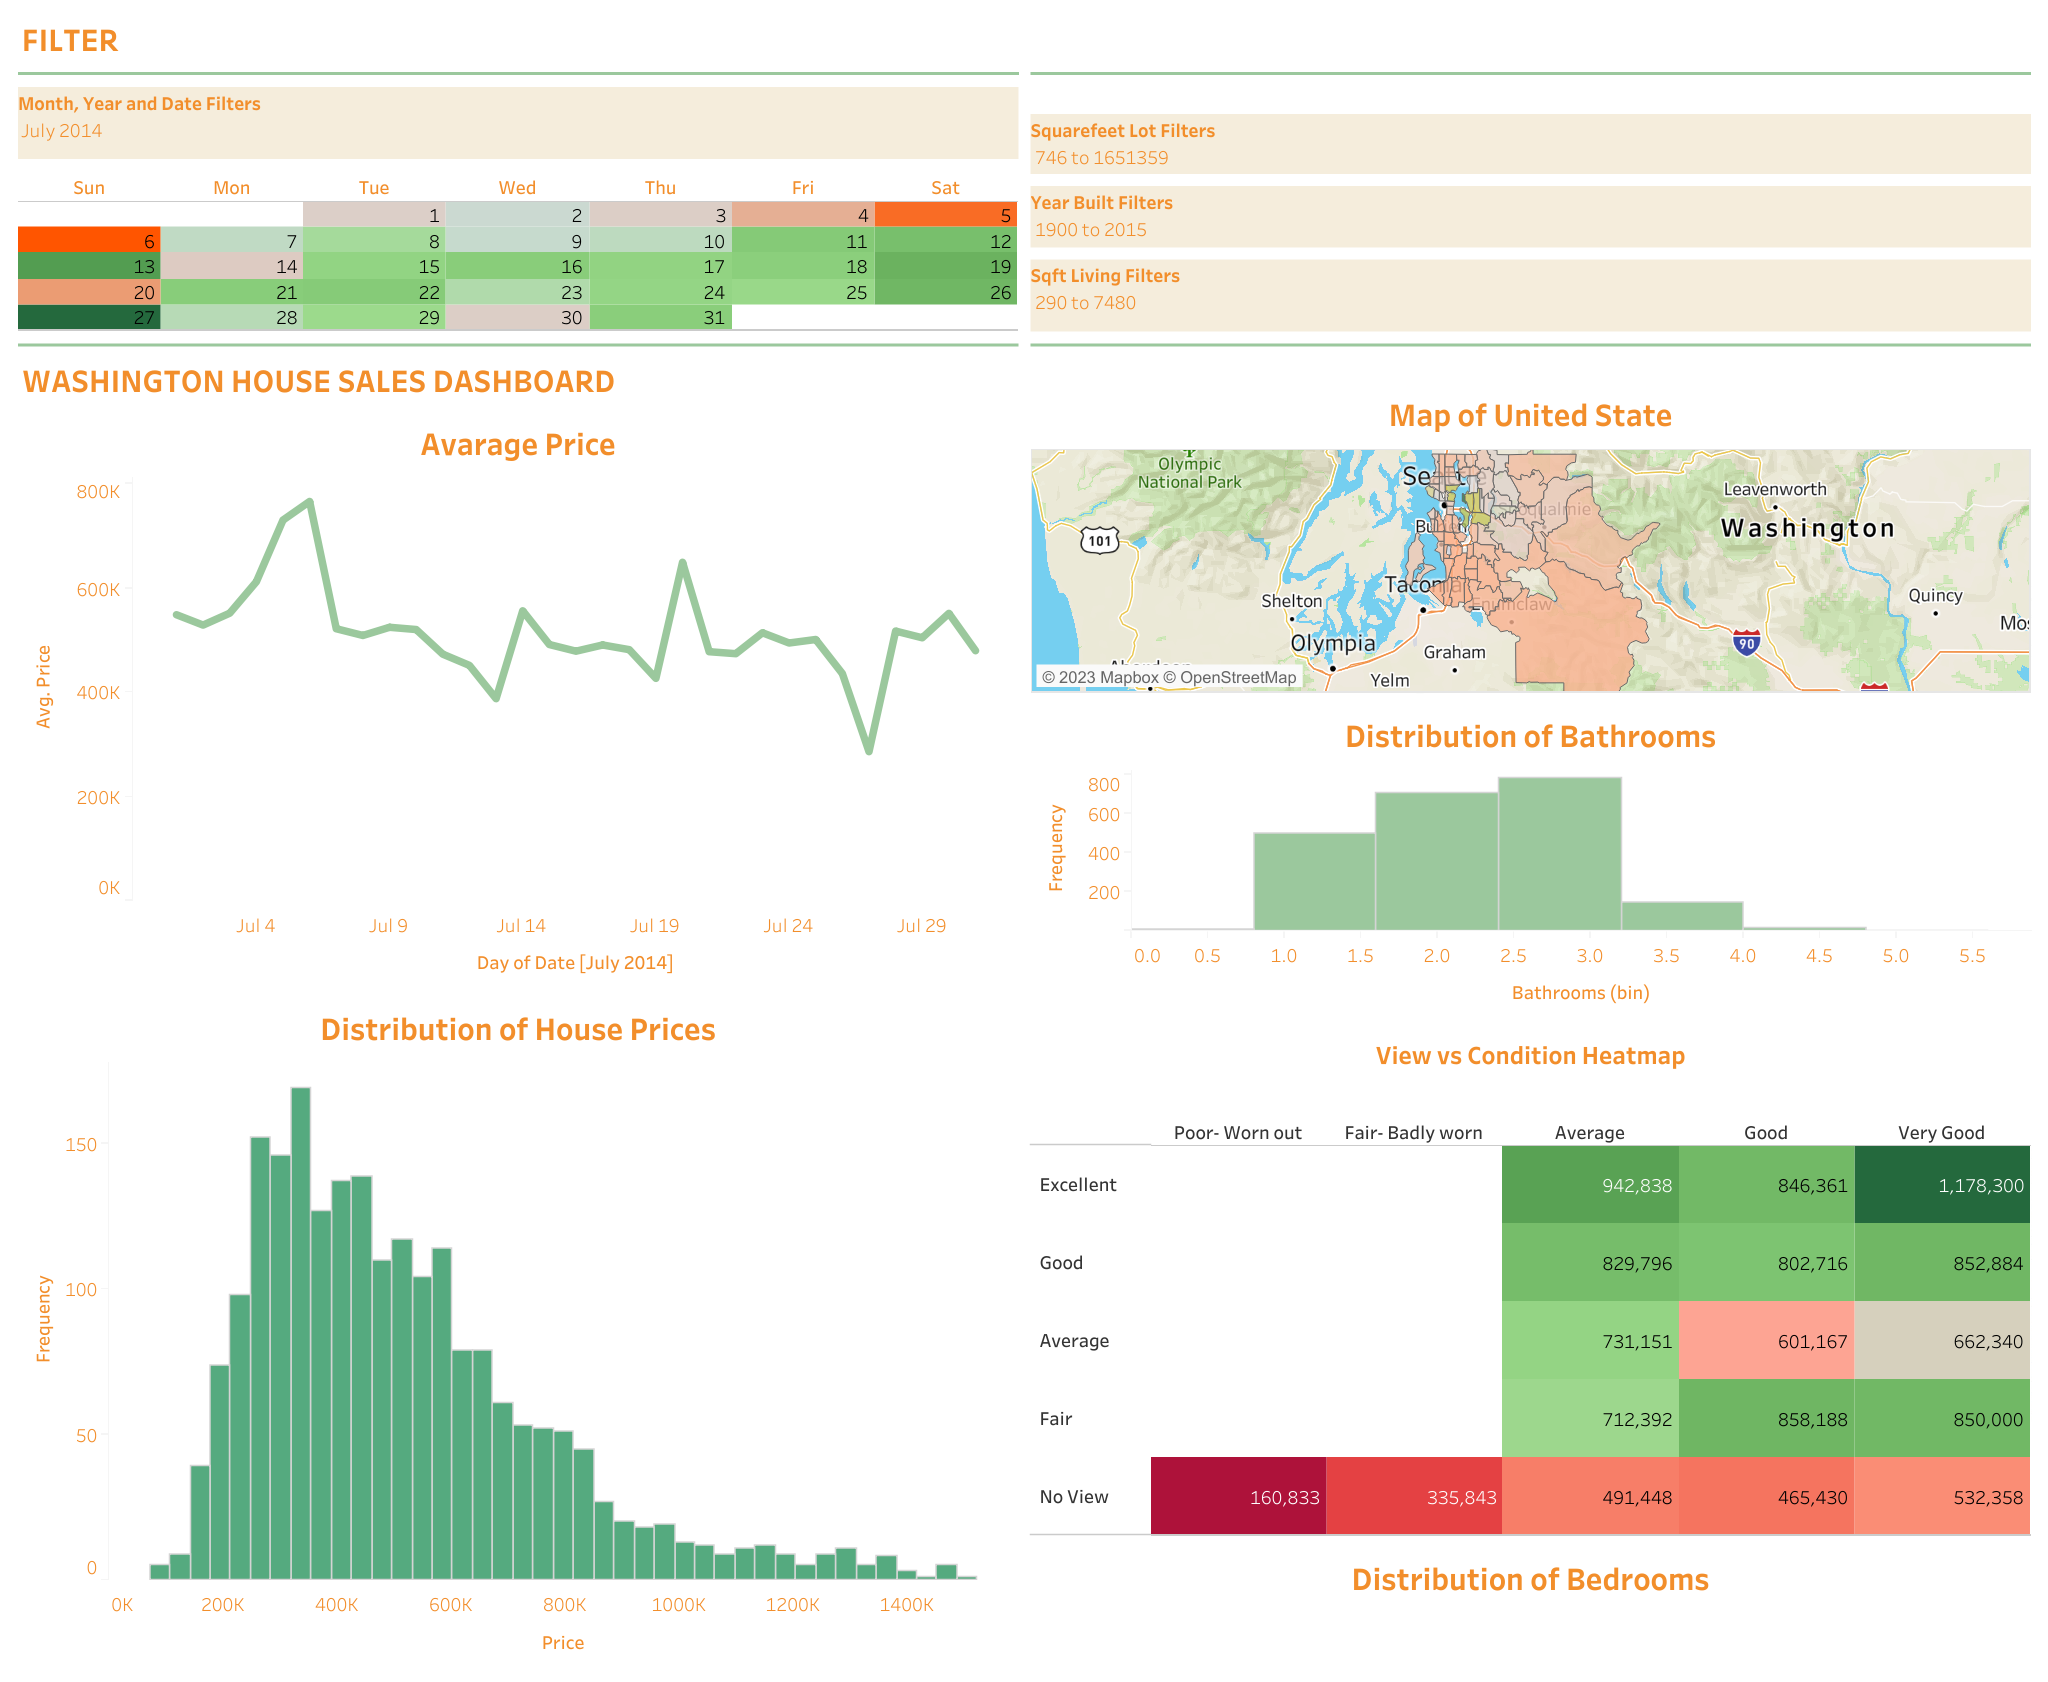
Additionally, geographical location plays a crucial role, as homes situated in certain areas are associated with higher price tags. This data visualization not only highlights the positive correlation between land size and home amenities but also underscores the influence of location on housing prices. It serves as a valuable tool for prospective buyers, real estate professionals, and investors seeking to make informed decisions in the competitive Washington housing market.